One of the features being introduced in the upcoming WordPress 3.1 release is the new Admin Bar. This is designed to make it easier to get access to the more common administration area tools from the front end of your site but also introduces the possibility to easily integrate extra debugging features into your site for use in testing environments or production environments to help track down things like slow queries, PHP notices and warnings, and usage of deprecated functions.
During the development and RC phase for WordPress 3.1 some of the core development team have worked on building a plugin which adds these debugging features to any site running WordPress 3.1 or later. The plugin started out with a very basic feature set just including MySQL query debugging information and statistics from the installed object cache based on the code that is used on WordPress.com. Overtime we have added reporting of PHP notices and warnings, Logging of calls to the things that are deprecated (code derived from the Log Deprecated Notices plugin by Core Developer Andrew Nacin) and information about the WordPress Query being run as well as how the current request has been parsed by the WordPress rewrite engine.
The plugin requires WordPress 3.1 as it hooks into the new Admin Bar and I’m sure will be of great use to all WordPress core, plugin, and theme developers.
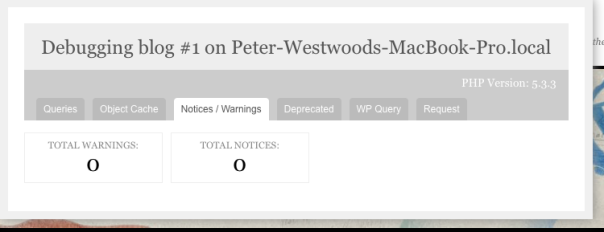
By default the MySQL queries and PHP Notices / Warnings tabs are not displayed. If you enable MySQL query recording with the SAVEQUERIES define in your wp-config.php then the queries tab will show. If you enable WP_DEBUG in your wp-config.php then the PHP Notices / Warnings tab will show.
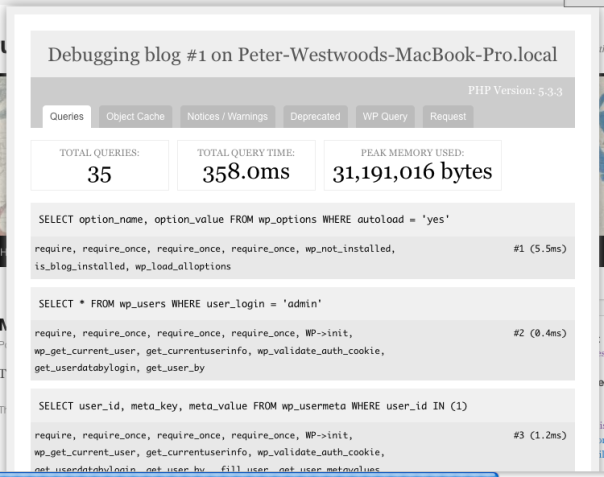
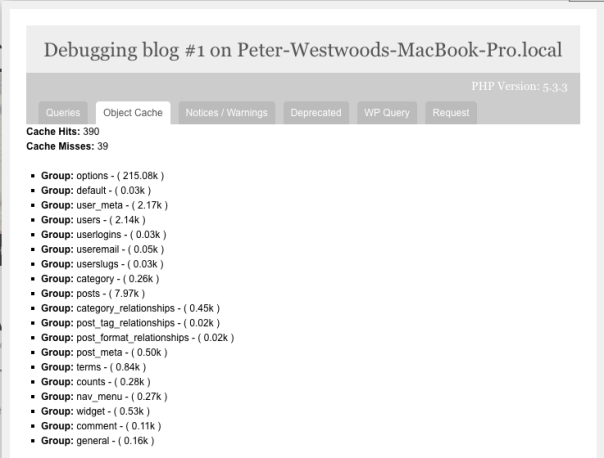
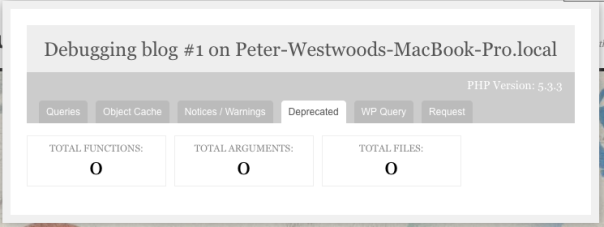
Here are some screenshots of the plugins different tabs:
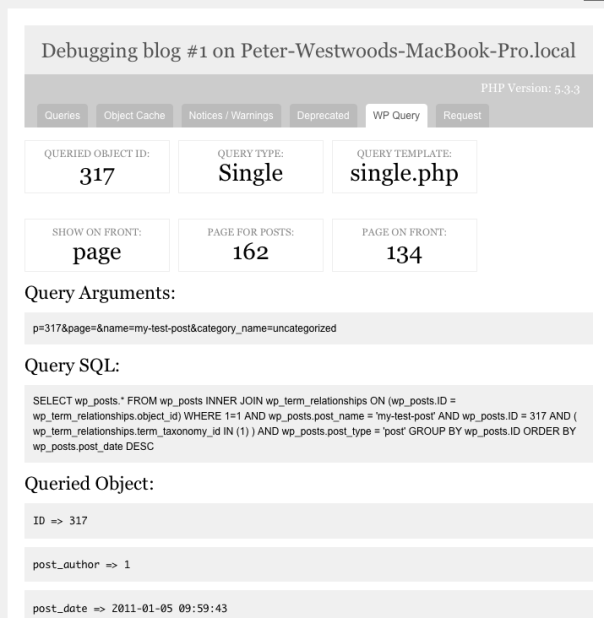
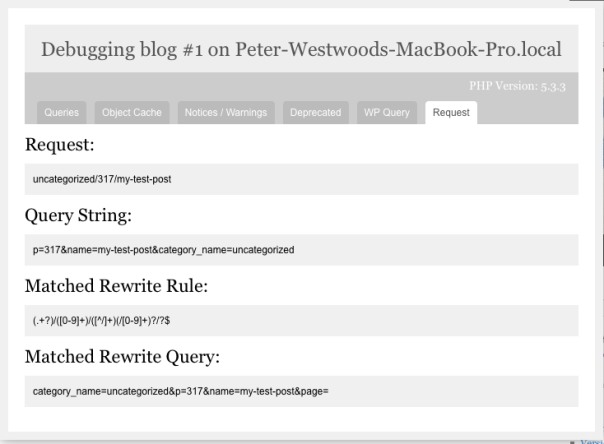
You can find the plugin in WordPress.org Extend here: http://wordpress.org/extend/plugins/debug-bar/
Is there something else you think this plugin could provide debugging information on?
I personally want to see memory size in KB or MB instead of bytes
I guess maybe MB make more sense but then it makes it harder to observe small changes in the value between pages or code changes
This is a brilliant solution! Will help a lot in debugging and knowing what’s eating up more resources. Glad to have this plugin in the repository.
And yes its right to display them in bytes so as to able to see minor variations.
Thank you! I was just about to start formalizing my own debug plugin, and now can extend yours instead.
Cheers,
~ Eric Marden
We’ve had our own debugger that dumps this output to the html comments for years now, but this is somewhat more user-friendly and will be of use to more people. Well done there – very nice.
I used to do the same with stuff like the query logs.
This makes it so much easier 🙂
Certainly more accessible to a wider range of folk. Most importantly, it makes for a very easy way to show people why theme A is slowing down their site in comparison to theme B. It helps to show quality differences, and that’s useful.
We’ve had clients say “can we try this theme please?” to which we’ve had to point out that the 350 queries and four second page build times aren’t really a good idea!
Yeah that isn’t good 😀
Impressive! Can’t wait to sift through the queries to see if there’s room for improvement.
Nice!
I’ve been using a query monitoring and debugging plugin I wrote a long time ago now (I’m sure many many other developers do too). Presentationally, mine is crude but it provides the exact information I want. Here are some other things from it that could go into Debug Bar:
1. A list of the WordPress conditionals that evaluate to true (is_home(), is_single(), etc).
2. Expensive queries (longer than 0.2s by default, but configurable) are highlighted in red so they can be investigated.
3. A list of all WordPress actions in the order they’re fired (but only actions, not filters, as there are too many).
4. Split each SQL query onto newlines at keywords so they’re easier to read.
5. List of functions that perform SQL queries, grouped by function and ordered by their total request time (you end up with get_posts(), get_user_by(), etc). Makes it easy to see problem functions.
6. Stack trace for everything displayed on mouseover (with all requires and includes stripped out for simplification).
7. List of every HTTP request performed (by the WP_HTTP class) with request info and response stats. Fairly edge case usefulness.
John,
These are great suggestions! I think we’ve already done #1. Also, as Peter will tell you, patches welcome. 🙂 A bunch of us are or will be working on this. I’ll likely even roll in my Log Deprecated Notices plugin into it, or more likely spin off a shared library to make it easier to upkeep.
Cheers,
Nacin
I do not know if it would be possible, but i would prefer automatic setting without need to modify config.php by hand and option to enable this debug bar only if Admin is logged in.
The debug bar is only visible for Admins (or Super Admins if multisite)
I wonder if I can dump the Supercache debug log in there. Are there hooks to add another debug log tab?
Yes and Yes 🙂
Look at the function
debug_bar_listand thedebug_bar_listfilterPatches on improvements for these hooks welcome
Great, I’ll have a look at this too. My plugins usually var_dump() or error_log() stuff in a useful but ugly way, so it’s probably neater and more efficient to hook into this.
This will make my live easier. Now I’m dumping debug info all over the screen.
Are you planning anything on php memory used and/or time used?
Peak memory used is shown on the Queries Tab.
Page generation time isn’t shown anywhere at present I don’t think
I’ve just updated to the latest version of Debug Bar (I’m running WP 3.1-RC2) and it no longer appears on the Admin Bar. Is there any reason why this might be the case?
Thanks.
It’s working fine for me still.
Has the plugin been de-activated?
Are you logged in as an Admin (or Super Admin if multisite)?
A definate problem, I’m sorry to say. I’ve just re-installed version 0.2 of Debug Bar and the debug option appears in the Admin Bar. I then replaced this with 0.3 and it disappears.
Yes, I’m signed in as Admin and can see the standard admin bar at the top of my blog.
Very Strange 😦
From memory the only changes between 0.2 and 0.3 were the addition of extra information tabs
Is there anything I can to assist with this? Any information I can collect for you?
Ignore the above. I hadn’t realised that the Debug button had moved to the right hand side of the search field – I was running the screen windowed and hadn’t noticed it.
Apologies.
After my, ahem, previous problems with Admin Bar (which turned out to simply be me not noticing that the Debug menu option had moved) I now have, what I believe, is a genuine problem.
I’ve just installed version 0.5 and clicking on “Debug” causes, well, nothing to happen. No Debug menu appears or anything.
I’ve tried previous versions and it appears to “break” with version 0.4.
As mentioned before, I’m running WP 3.1-RC2.
Wierd. In the latest version of the debug bar it now appears at the bottom of the screen as a slide up section rather than the pop-up over the whole page.
Which browser are you using?
Firefox 3.6.13 under XP and 7 64-bit.
I’ve looked at my source code and, particularly, the admin bar. Should the link to the debug option simply be an empty anchor, as that’s what I’m seeing. When I click on it, it just refreshes the page.
0.6 doesn’t work either.